
| Acronym | Electoral contestant |
|---|---|
| ALDE | Alliance of Liberals and Democrats for Europe |
| AM | Moldovans Alliance |
| AUR | Alliance for the Union of Romanians |
| BEA | Alternative Bloc |
| BEP | Patriotic Electoral Bloc |
| BEÎ | Together Bloc |
| CI-AN | Independent candidate, Andrei Năstase |
| CI-OS | Independent candidate, Olesea Stamate |
| CI-TC | Independent candidate, Tatiana Crețu |
| CI-VS | Independent candidate, Victoria Sanduța |
| CUB | Coalition for Unity and Welfare |
| LOC | League of Cities and Communes |
| MRM | Respect Moldova Movement |
| NOI | New Historical Option |
| PAS | Party of Action and Solidarity |
| PDA | Democracy at Home Party |
| PL | Liberal Party |
| PN | Our Party |
| PNM | National Moldovan Party |
| PSDE | European Social Democratic Party |
| UCSM | Christian-Social Union of Moldova |
Who funded Moldova’s 2025 parliamentary campaign? Donations and income structure
campaign finance
donations
volunteers
elections
Moldova
This blog post looks at the income side of Moldova’s 2025 parliamentary campaign. Using the official financial reports filed by electoral contestants, it shows how much money each contestant raised, where it came from, and how broad was their donor pool. It is based on my analysis in the Moldovan Analytical Digest.
The parliamentary elections of 28 September 2025 in Moldova were held under stricter campaign finance rules. The amendments passed in June 2025 (Monitorul Oficial, 2025) were a response to large-scale illegal financing and foreign interference around the 2024 presidential election and the EU accession referendum. In this post, the first of a few based on my analysis in the Moldovan Analytical Digest (Lipcean, 2026), I look at the income side of the parliamentary campaign: how much money the contestants raised, where it came from, how many contributions they received and how these were distributed among the donor pool.
There is one caveat that should be mentioned. The analysis relies on the official financial reports that contestants filed with the Central Electoral Commission (CEC) through its online financial control platform (Comisia Electorală Centrală, 2025). It therefore says nothing about illicit or undeclared funding, which is by nature hard to measure. It can nevertheless reveal how legally declared resources are distributed among contestants, and that distribution is far from equal.
The rules of the game
During this campaign, individuals could contribute up to six average monthly wages (AMW; MDL 96,600, about €4,950), while legal entities up to twelve AMW (MDL 193,200, about €9,900).1 Cash donations were capped at one AMW (MDL 16,100, about €825), businesses could donate only by bank transfer, companies with outstanding debts to the state budget or social security and health insurance funds were barred from donating. Moreover, electoral competitors could not accept in-kind donations without advance payment (Monitorul Oficial, 2022). Besides private money, contestants could move up to 70% of the state subsidies available in their party accounts into their election account.
NoteAcronyms of electoral contestants
Who raised the money?
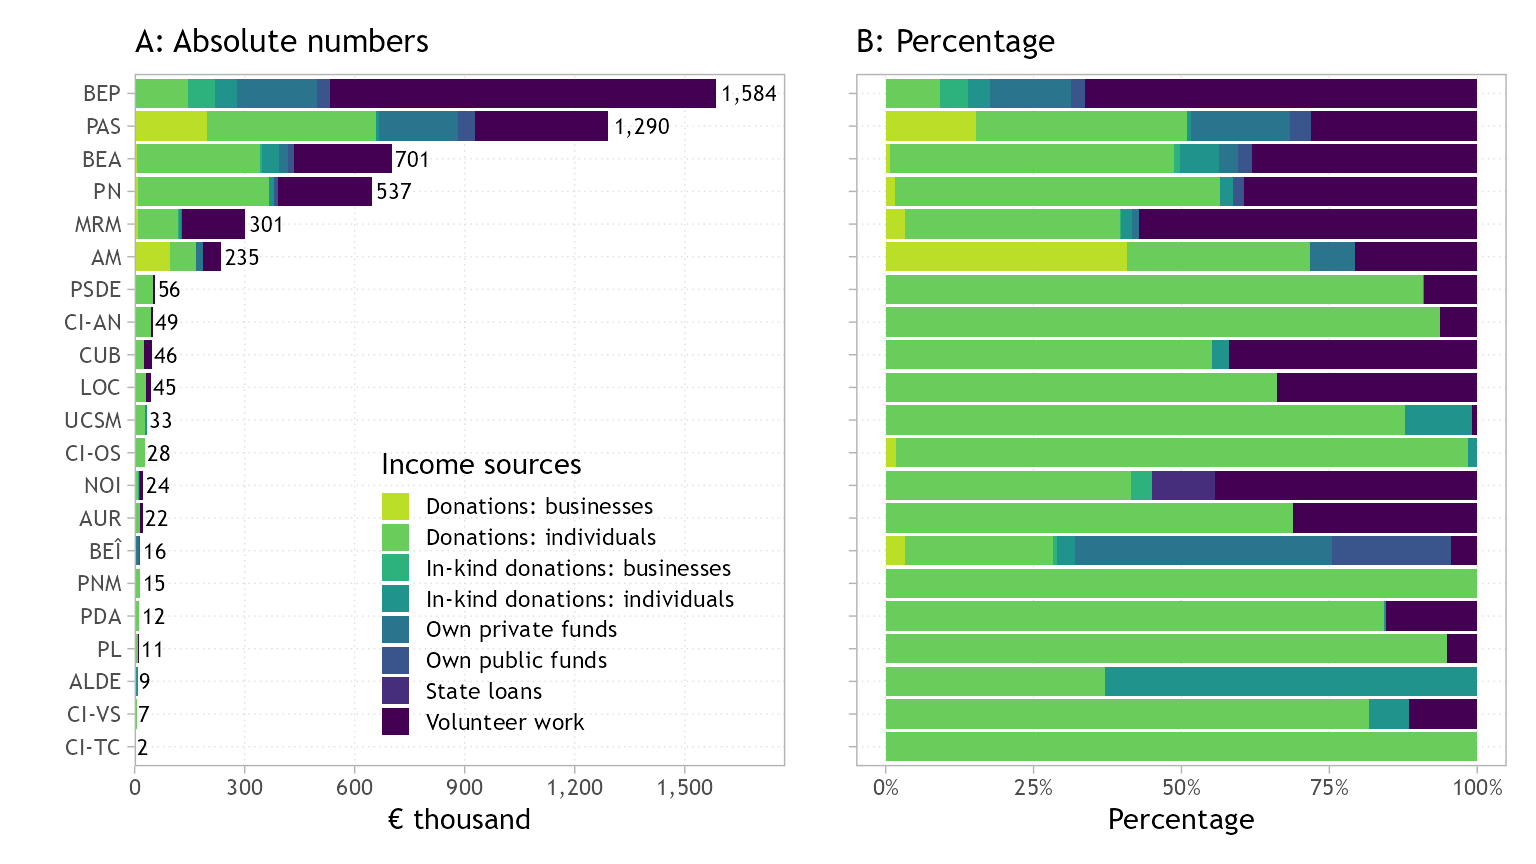
Collectively, the 21 electoral contestants collected about €5.0 million of reported income. Panel A of Figure 1 shows that this money was extremely concentrated. The Patriotic Electoral Bloc (BEP) and the Party of Action and Solidarity (PAS) each raised more than €1.2 million, followed by the Alternative Bloc (BEA) and Our Party (PN). These four contestants alone account for €4.11 million, or 82% of the total, while the remaining 17 collected together €0.91 million. The best-funded bloc raised several hundred times more than the smallest contestants.
Figure 1 has two panels that show the structure of campaign income in absolute and relative terms. Panel A displays the ranking of electoral contestants from the largest to the smallest in terms of total income and its distribution by funding source, while Panel B displays the share of each income source from the total income.
Where did the money come from?
Panel B of Figure 1 shows that contestants also relied on very different sources of money. Volunteer work, valued by the contestants themselves, is the largest income source (43% of everything reported), followed by donations from individuals (34%). Own funds, donations from businesses, in-kind donations and state subsidies that parties moved to their campaign accounts each make up much smaller shares.2
Behind these totals are different strategies. For instance, PAS, the party in government, exhibits a relatively balanced income structure collecting funding from several sources: individual donations make up 36% of its reported income, volunteer work 28%, its own funds 17% and donations from businesses 15%. BEP, by contrast, relied heavily on volunteers for 66% of its income and received no business donations at all. BEA and PN relied mostly on individual donors (48% and 55%), plus volunteer work. Most smaller contestants exhibit less balanced budgets, depending on one or two sources, which left them financially vulnerable.
The scarcity of business money
The shortage of business donations is reflected by the fact that only two contestants collected large amounts from businesses: PAS (€197,528) and the Moldovans Alliance (AM, €96,000). For PAS this represents 15% of its income, whereas for AM it constitutes 41%, so AM depended much more on business money. All other contestants collectively amassed only €25,806 from businesses. Business money was therefore scarce, and went mostly to the party in government. A question still remains, whether some business contributions were disguised and reported as individual donations. Some journalists have raised this issue, for instance here, and I touch upon it in the digest (Lipcean, 2026).
Donor pool and donation value
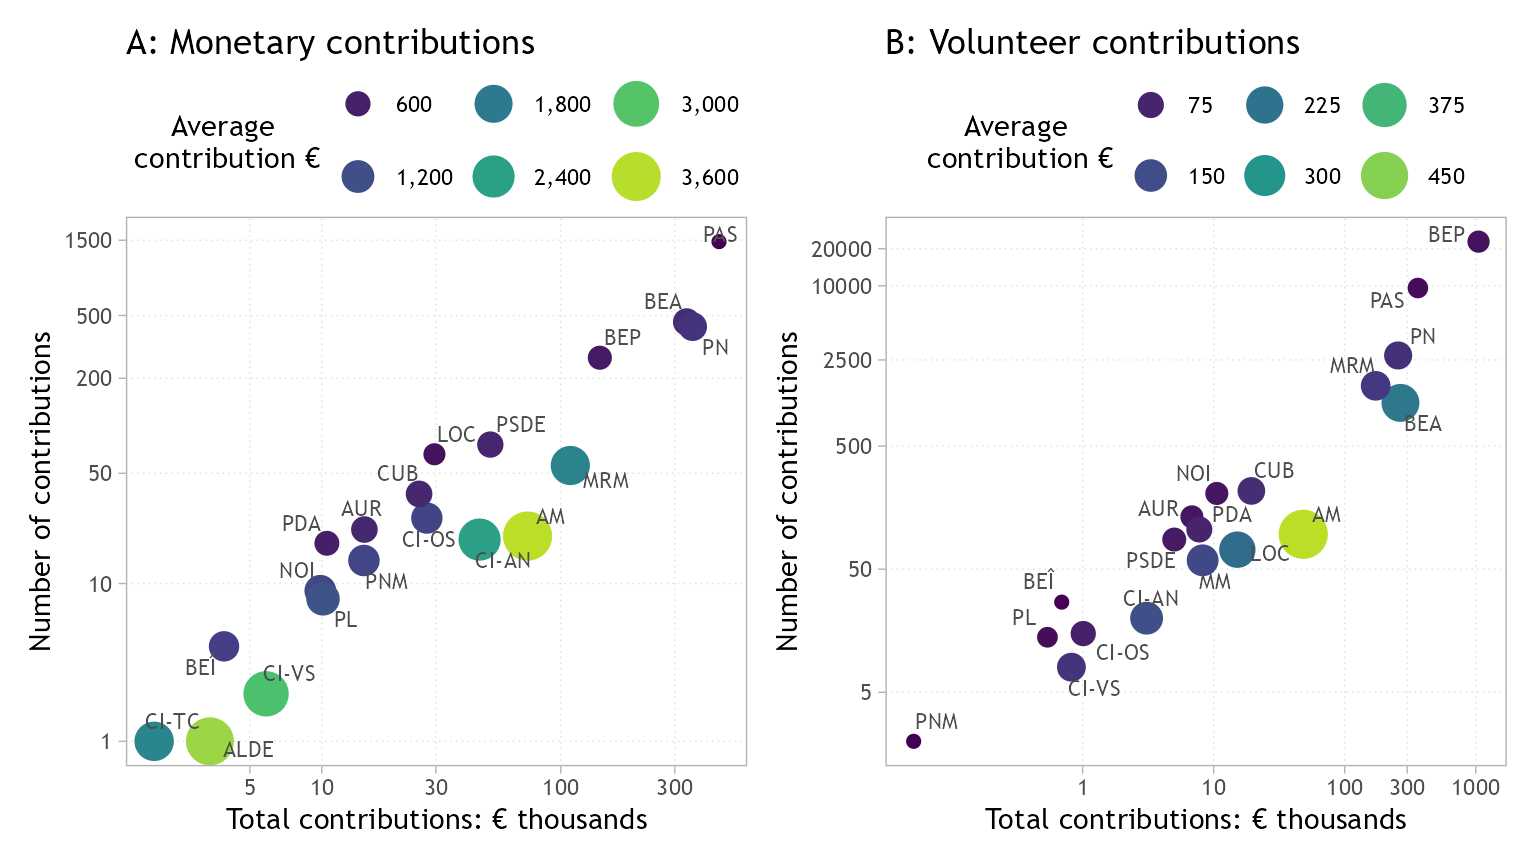
Totals do not show how contestants raised their money, so Figure 2 plots, for each contestant, the total amount raised (x-axis) against the number of contributions it received (y-axis) by the size of average donation. Both axes use a logarithmic scale to show both small and large values in the same plot. The size and colour of each point show the average contribution by electoral contestant. Panel A covers monetary donations, while panel B volunteer contributions. As panel A shows, PAS has by far the largest donor pool, 1,469, with an average of only €313 – the lowest donation value among contestants. This reflects a grass-roots fundraising strategy, that is, raising money from many small donors. BEA (455 contributions, average €739) and PN (425, €838) raised comparable amounts with larger average donations, while BEP collected only 270 monetary contributions (average €540). At the other end, 9 of the 20 contestants reported fewer than 20 monetary contributions. Notably, while AM received only 20 donations, it recorded the largest average donation per donor of €3,631.
Panel B shows even bigger gaps in volunteer work. BEP reported 22,833 volunteer contributions with a total value above €1 million, an average of only €46 each. PAS, the party in government, reported less than half as many (9,595), followed by PN (2,719), MRM (1,542) and BEA (1,120). Most other contestants reported fewer than 100 contributions. Hence, the volunteer activity widens the gap between contestants instead of closing them: well-funded contestants with strong organisations mobilised thousands of supporters, while those with little money reached a very narrow pool of volunteers.
What this means for competition
The playing field was very uneven. A small group of well-established contestants raised far more than everyone else, and they used several sources at the same time: individual donations, business money, their own funds and volunteers. Most of the others depended on one or two sources, usually small individual donations or a handful of volunteers. At the same time, the money was not concentrated in a single party. PAS, the party in government, was not the only one to raise large amounts: BEA, PN and BEP did too, and several contestants mobilised thousands of volunteers.
Did this money turn into votes? I come back to this in a later post, after looking at how contestants spent their money.
References
Comisia Electorală Centrală. (2025). Sistemul informatic “Control financiar”. https://finante.cec.md/reports.aspx
Lipcean, S. (2026). Campaign financing in Moldova’s 2025 parliamentary elections. Moldovan Analytical Digest, 5, 2–17. https://doi.org/10.3929/ethz-c-000793910
Monitorul Oficial. (2022). Codul Electoral. https://www.legis.md/cautare/getResults?doc_id=134589&lang=ro
Monitorul Oficial. (2025). Lege Nr. 100 din 13-06-2025 pentru modificarea unor acte normative (combaterea eficientă a fenomenului corupției electorale și a aspectelor conexe acestuia). https://www.legis.md/cautare/getResults?doc_id=148941&lang=ro
Footnotes
Throughout this post, amounts in euro are converted from lei at about MDL 19.5 per euro.↩︎
The value of volunteer work is set by the contestant, using the AMW as a reference. It depends on the level of the electoral body the volunteer worked for: 50% for representatives at the Central Electoral Commission or in courts, 30% at second-level district councils, 20% at first-level district councils, and 10% at polling stations.↩︎